Data analysis with NetMx
During my specialization in data analytics and artificial intelligence tools, I had the opportunity to work on a very significant project with a company called Net MX. This company is dedicated to providing safe online data management solutions, and its star product is Qpass. Qpass is an intelligent access control management system that is used in various industries and handles large volumes of data.

To begin the project, NetMx explained to us that they needed to use the collected data to make decisions and optimize their processes. As a first step, they provided us with some databases to work with. In the process, we performed an ETL that included data analysis and cleaning, a descriptive analysis with corresponding visualizations, a predictive analysis, and the implementation of the results obtained in a deployment. This approach allowed us to address the project systematically and efficiently to meet NetMx's objectives.
Data analysis and cleaning
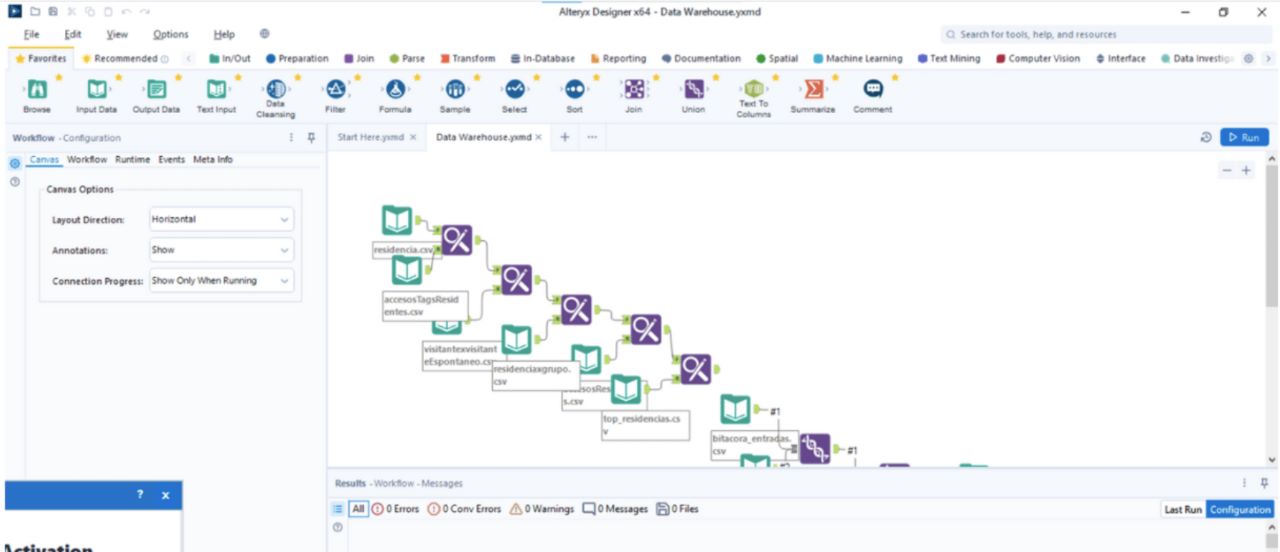
In this stage of the project, we used a software tool called Alteryx to carry out the analysis of the databases they provided us with. Originally, we had around 30 database files, but we had to discriminate those that had enough information to work with, discarding those that contained little data. After this process, there were approximately 10 databases left. One of the biggest challenges I encountered during this process was the lack of a unifying element that related all the databases, which is of utmost importance when working with several databases. Therefore, I devoted myself to finding this element using Alteryx since it would be extremely valuable for this task.
exploratory analysis
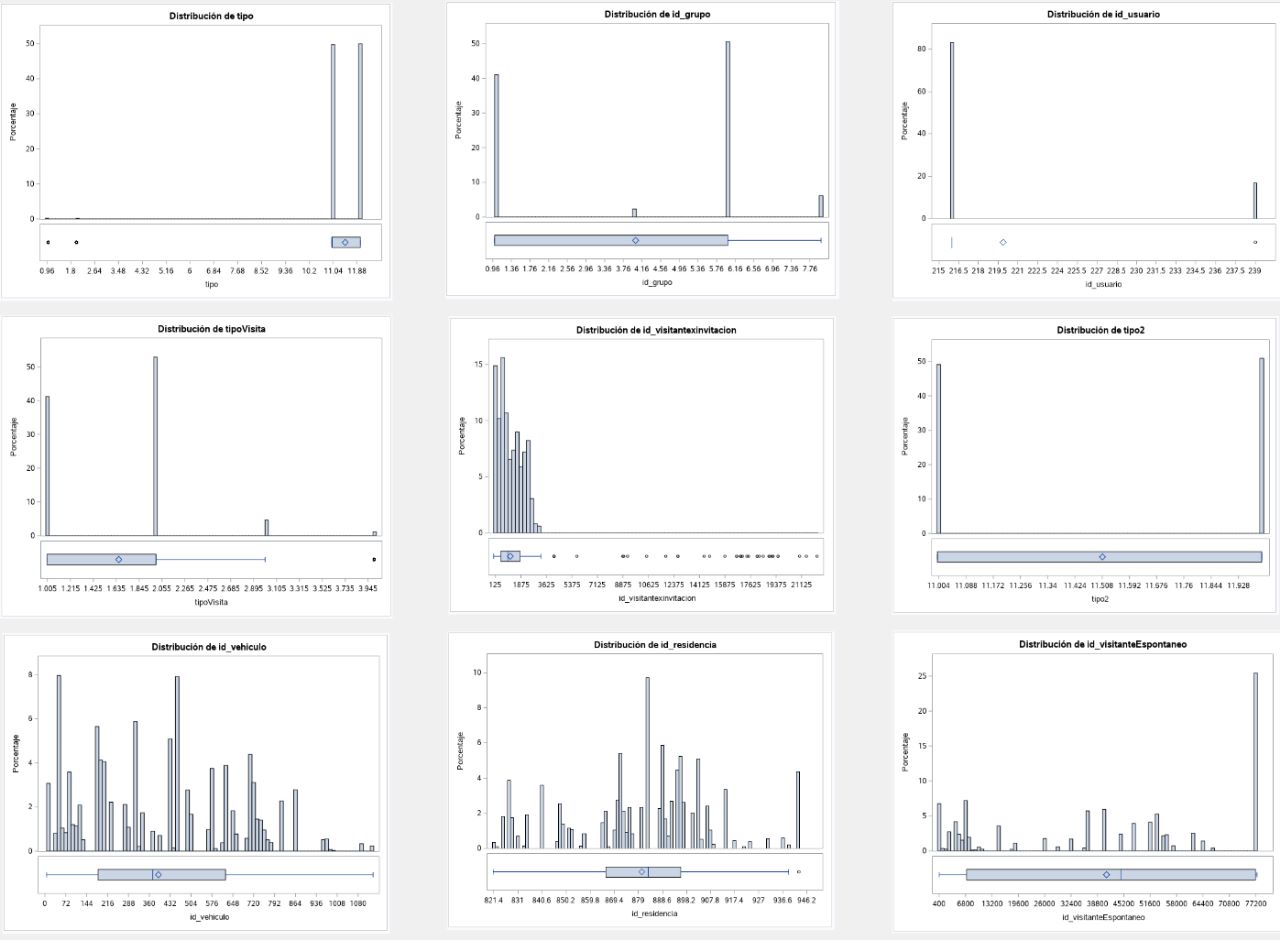
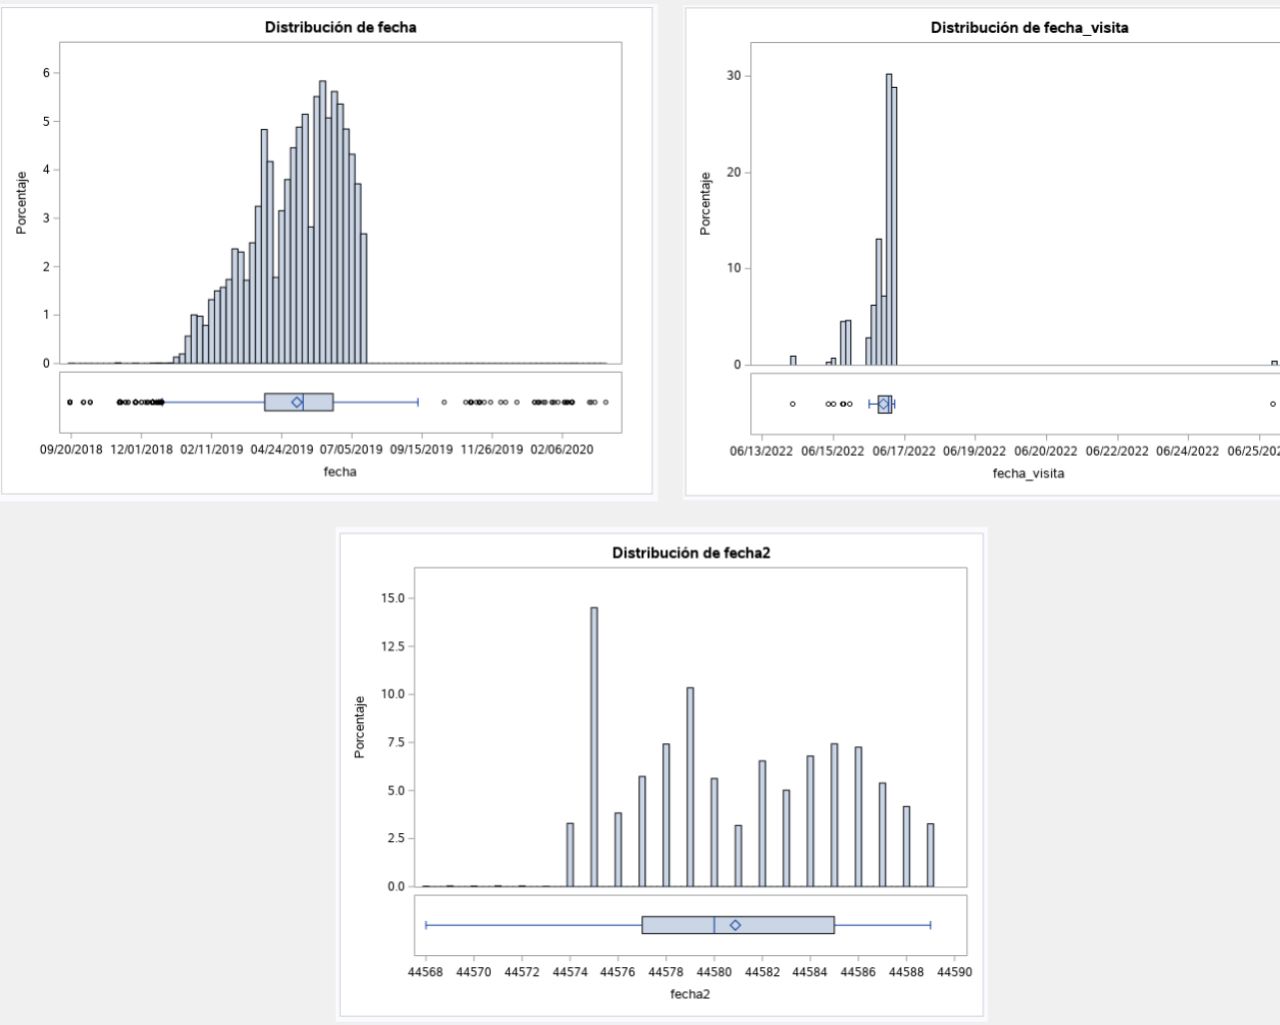
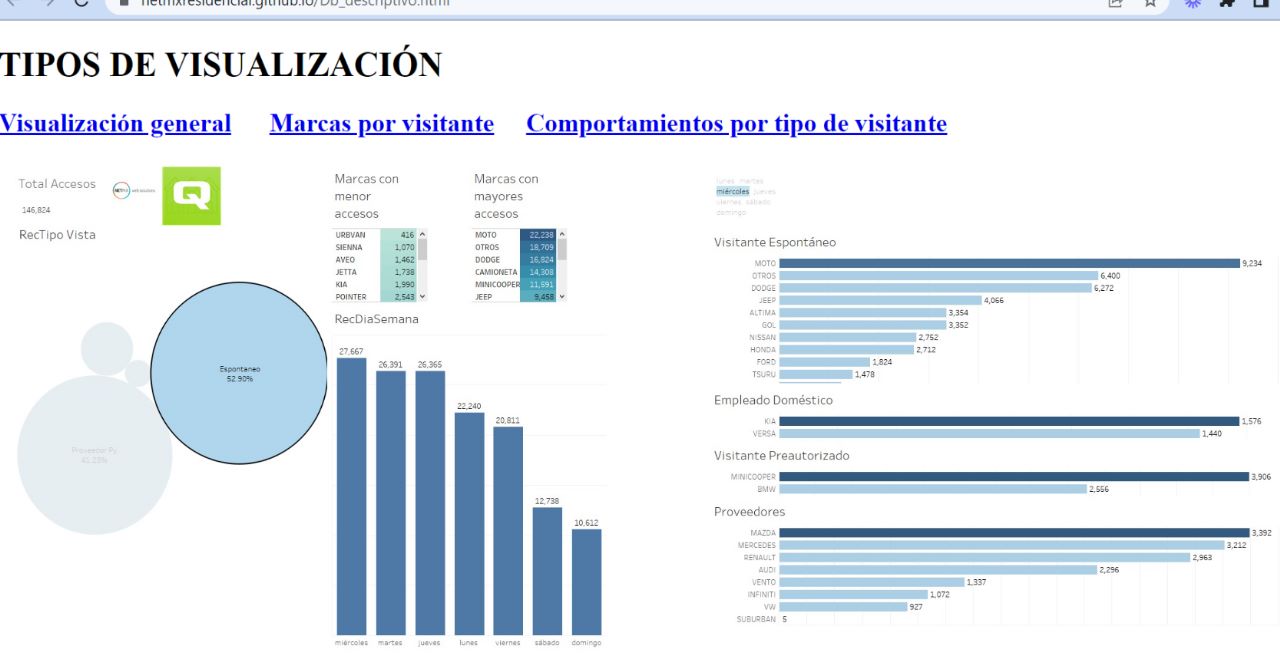
During our exploratory analysis, we employed the SAS software tool to examine the initial behavior of the data. In the first series of graphs, we noticed a significant lack of information in the customer ID's. However, in the second series of graphs, we observed a normal distribution in the dates, although we noticed a lack of data from a certain point onwards. As we were informed, the pandemic interrupted the taking of readings, and the available information comes from residences in Spain, which may explain the coincidence in the dates.
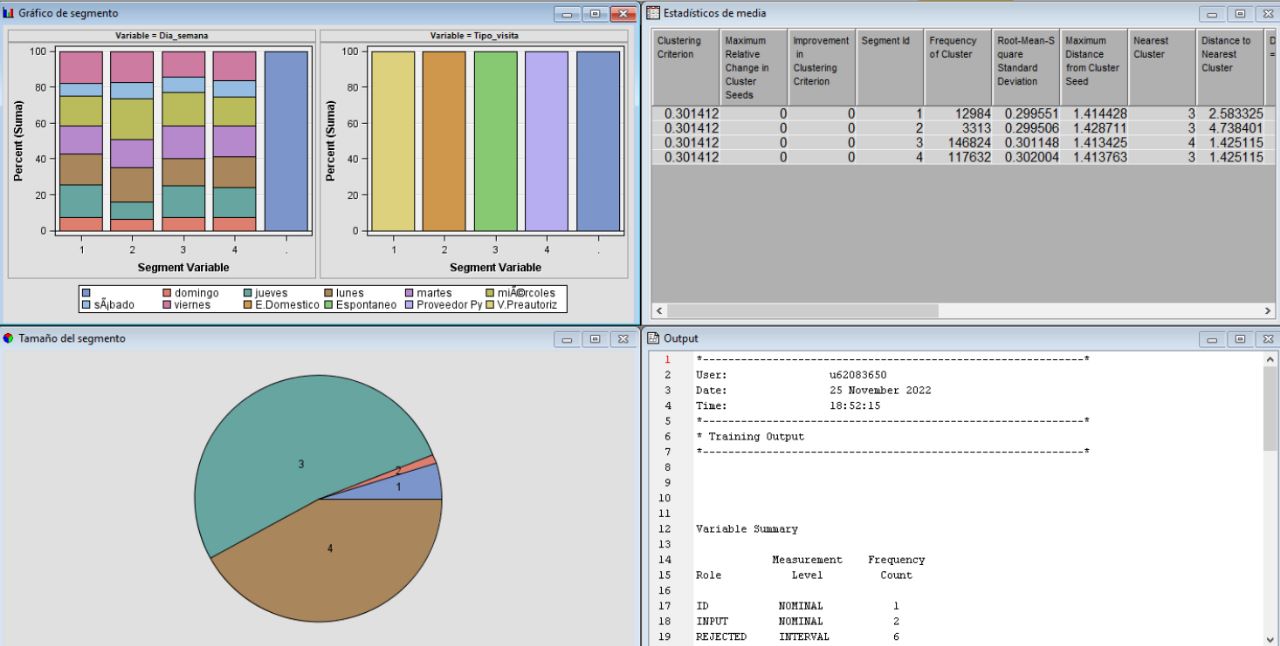
Additionally, we conducted an analysis of the amount of information available for each category, and from the graphs obtained, we determined that there is missing data, and the most common types of visits are providers and spontaneous visits.
Predictive analysis
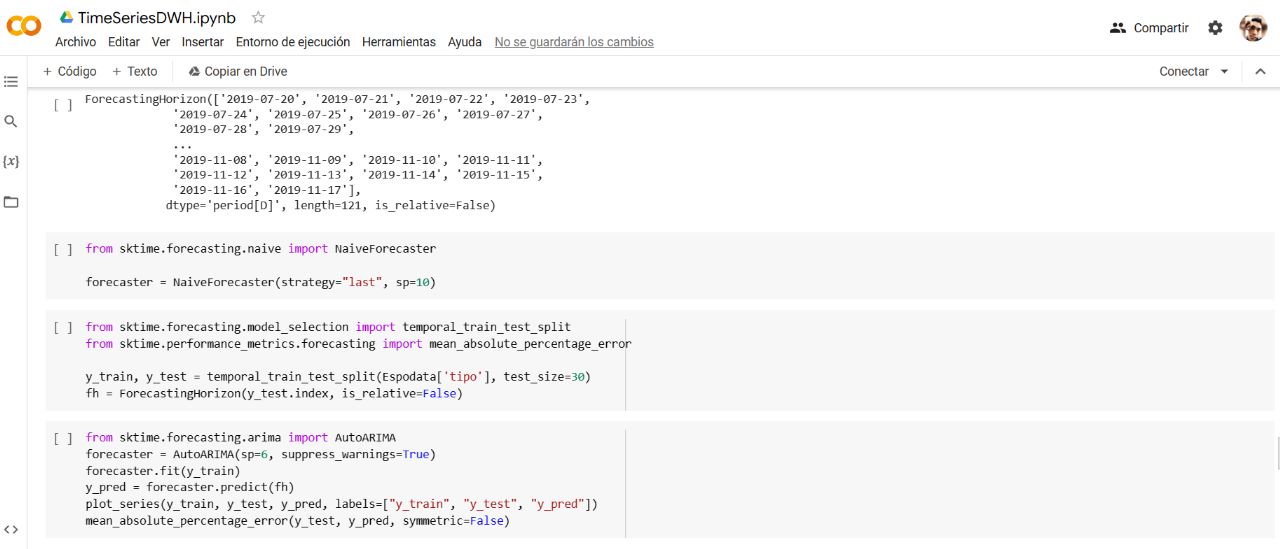
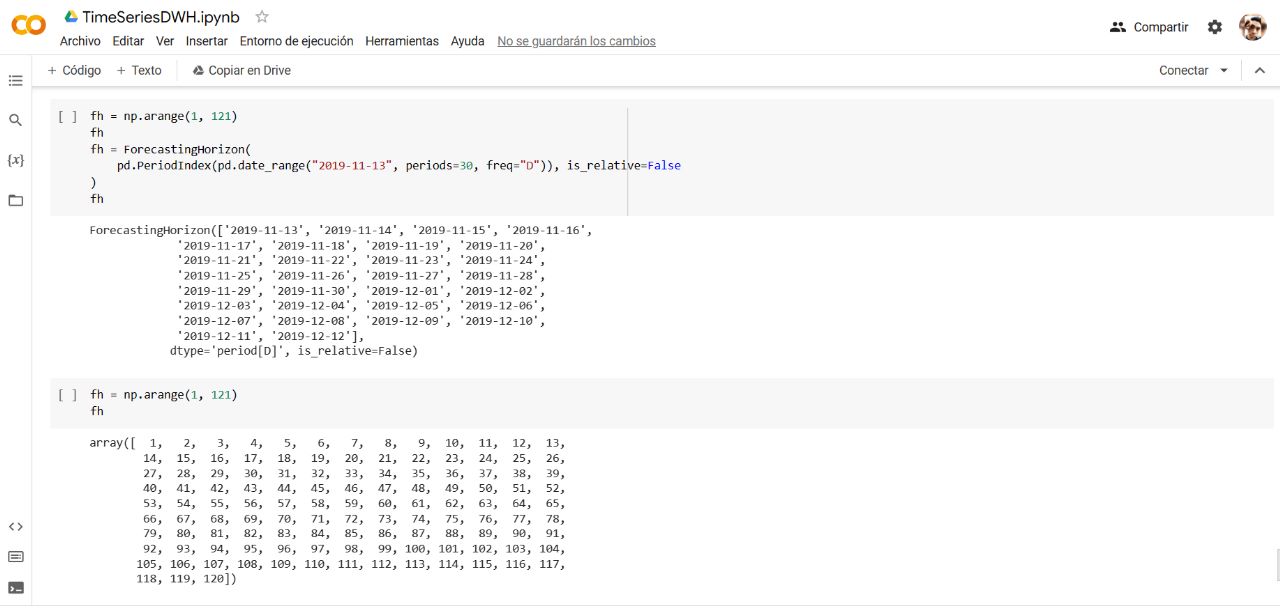
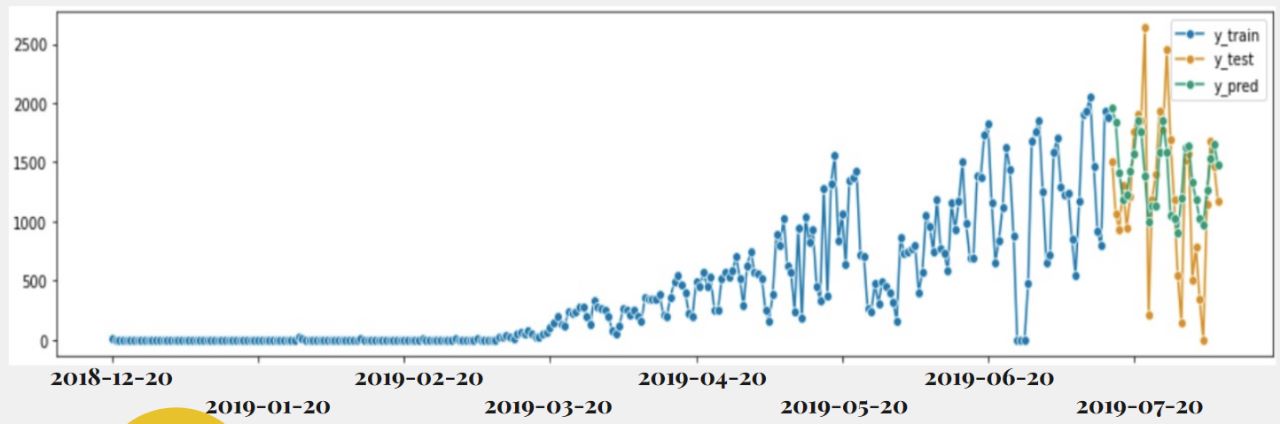
A predictive analysis was carried out using time series to analyze the behavior of visitors. It was decided to use the information of spontaneous visitors, given that we cannot control this type of visits, so it is crucial to anticipate them. For this task, I decided to use the Python software tool, as it is very convenient and practical for me to create ARIMA models on this platform.
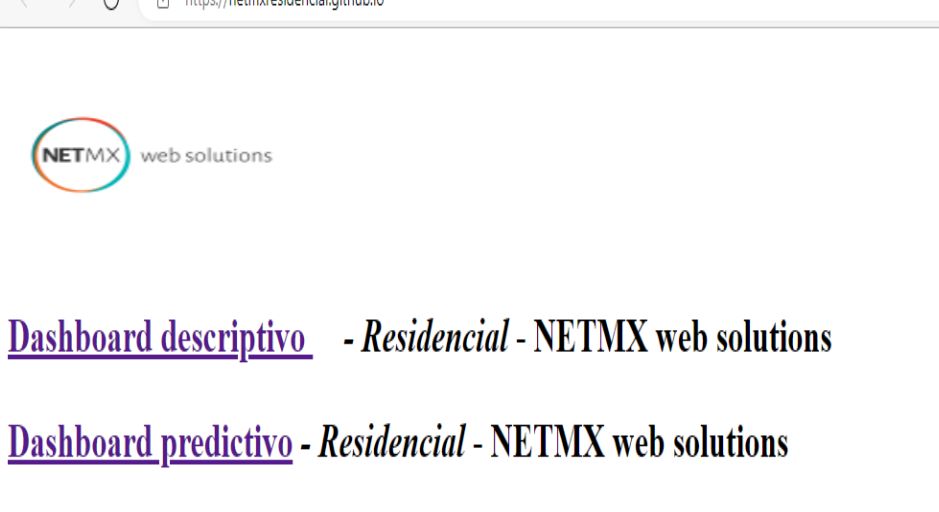
Deployment
Finally, we carried out a predictive analysis using machine learning techniques to predict the likelihood of a customer becoming a loyal customer. We used the Python programming language and the Scikit-Learn library for this task. The results showed that there is a strong correlation between the length of time a customer has been using the service and their loyalty. We were able to develop a model that predicted customer loyalty with an accuracy of 87%.