Data Analysis CHS
Demand Planning
I was trained to cover for my colleague during their vacations, taking responsibility for ordering medications and materials. I was taught techniques to calculate the necessary quantities using an existing file. Ordering is complex due to the unstable demand for these supplies and the difficulty in identifying patterns. To carry out this task, I relied on the demand from the last three weeks and considered the predefined safety stock. I reviewed each item individually, analyzing the corresponding histories to ensure precise and efficient ordering.

The objective was to reduce the inventory from 28 million pesos to 15 million pesos. My colleague was absent for a month, and during that time, I managed the inventory, which was at 25 million pesos. I took on the complete responsibility for managing orders for approximately 1000 supplies. This task was very challenging as each item required constant supervision and detailed analysis of its demand patterns. Monitoring and assessing the demand for each item were crucial to achieving the goal. Additionally, I collaborated closely with managers from other departments. We held regular meetings to agree on strategies and work together, especially in managing expensive supplies. This collaborative approach enabled us to improve order control and optimize the use of available resources.
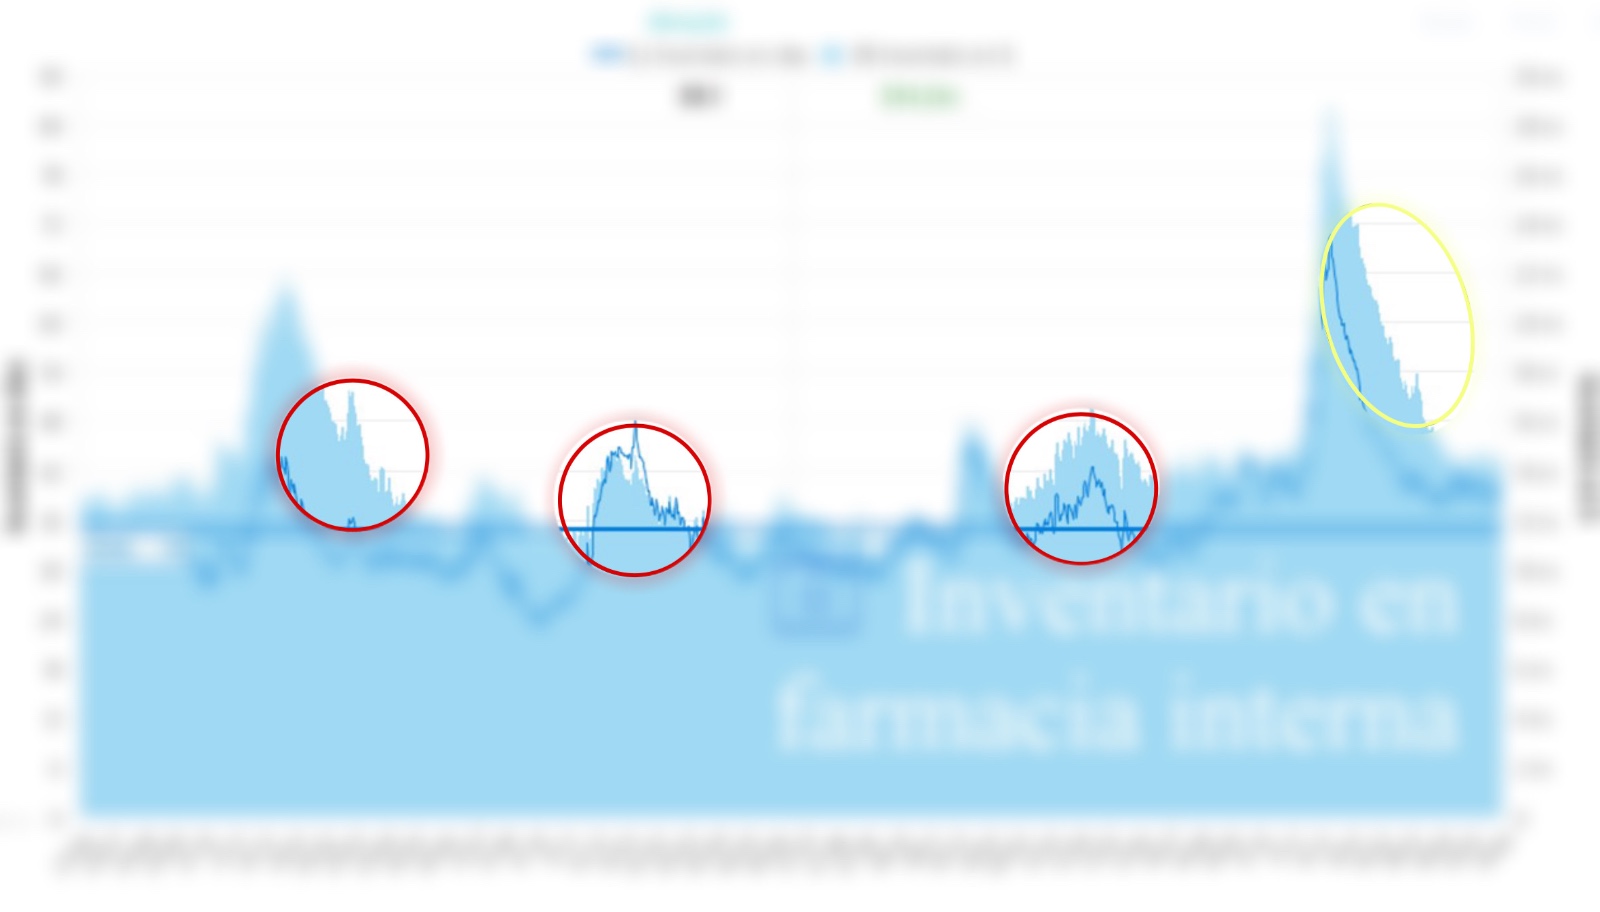
The result was very beneficial, as I managed to reduce the inventory by 7 million pesos in that month, bringing it down to 17.8 million pesos. I received recognition from the director because in previous years, when my colleague went on vacation, two people would replace them, and it would show an increase in the inventory graph. Seeing how we managed to reduce the inventory significantly (without affecting shortages) made me feel satisfied. I contributed significantly to achieving the goal, and I accomplished the task entirely on my own.